 |
The SKIRT project
advanced radiative transfer for astrophysics
|
|
The SKIRT project
advanced radiative transfer for astrophysics
|
An instance of the RGBImage class represents a single RGB color image, i.e. More...
Public Member Functions | |
| def | __init__ (self, source, frameIndices=None) |
| The constructor creates a new RGBImage from the source specified by the sole argument, as follows: More... | |
| def | addBelow (self, image) |
| This function places the specified RGBImage below the receiving image. More... | |
| def | addRight (self, image) |
| This function places the specified RGBImage to the right of the receiving image. More... | |
| def | applyColorMap (self, cmap) |
| This function applies the specified color map to the (scaled) pixel values of the red channel, and replaces the image data with the result. More... | |
| def | applyCurve (self, point1=(0.25, 0.16), point2=(0.80, 0.86)) |
| This function applies a transformation defined by a cubic spline curve to the (scaled) pixel values, and replaces the image data with the result. More... | |
| def | applyLog (self) |
| This function applies the natural logarithm function to the pixel values of the image, and adjusts the pixel range accordingly. More... | |
| def | applySqrt (self) |
| This function applies the square root function to the pixel values of the image, and adjusts the pixel range accordingly. More... | |
| def | bytesArray (self) |
| This function returns the image's pixel data as a bytes object in the rgba format that can also be obtained from mtplotlib (3 RGB channels plus a dummy alpha channel, 8 bits each). More... | |
| def | enlargeCanvas (self, shape) |
| This function adds pixel rows and/or columns to the receiving image if needed to match a given shape. More... | |
| def | percentilePixelRange (self, from_percentile=0, to_percentile=100) |
| This function determines the range of the image's pixel values, ignoring zero and negative values, and omitting outliers on both sides of the scale as specified by the from and to percentiles. More... | |
| def | pixelArray (self) |
| This function returns the image's pixeldata as a 3D numpy array with shape (nx, ny, 3). More... | |
| def | pixelRange (self) |
| This function returns the range of the image's pixel values as a tuple (min, max). More... | |
| def | plot (self, fill=False) |
| This function plots the image to the current axes in the current matplotlib figure. More... | |
| def | saveTo (self, outFilePath, tiff16bit=False) |
| This function saves the image to a file with the specified /em outFilePath in one of the supported formats. More... | |
| def | scaledPixelArray (self, newmin, newmax) |
| This function returns the image's pixel data as a 3D numpy array with shape (nx, ny, 3), after scaling the data to the specified range, but without affecting the data in the image itself. More... | |
| def | scaleValues (self, newmin, newmax) |
| This function applies a linear transformation to the pixel values and to the pixel value range, such that the previous range is exactly mapped onto the new specified range. More... | |
| def | setRange (self, newmin=None, newmax=None) |
| This function changes the pixel value range without affecting the actual pixel values except that, if the new range is smaller than the previous range, the pixel values are clipped to the new range. More... | |
| def | shape (self) |
| This function returns the image's shape as a tuple (nx, ny). More... | |
Private Member Functions | |
| def | _ensureArr (self, invalidate=True) |
| This private function ensures that there is a valid numpy array representation, converting from one of the other representations if necessary, and invalidating the other representations if requested. More... | |
| def | _ensureBuf (self, invalidate=True) |
| This private function ensures that there is a valid buffer representation, converting from one of the other representations if necessary, and invalidating the other representations if requested. More... | |
| def | _ensurePil (self, invalidate=True) |
| This private function ensures that there is a valid PIL image representation, converting from one of the other representations if necessary, and invalidating the other representations if requested. More... | |
| def | _setArr (self, arr) |
| This private function sets the specified numpy array as internal representation, invalidating the other representations. More... | |
| def | _setBuf (self, buf) |
| This private function sets the specified RGBA buffer or string as internal representation, invalidating the other representations. More... | |
| def | _setPil (self, pil) |
| This private function sets the specified PIL image as internal representation, invalidating the other representations. More... | |
Private Attributes | |
| _darr | |
| _dbuf | |
| _dpil | |
| _rangearr | |
| _shape | |
An instance of the RGBImage class represents a single RGB color image, i.e.
a 2D array of pixels with three color values per pixel. The class allows arbitrary floating point color values, and supports conversion to and from more standard image representations using 8-bit or 16-bit integer values. The floating point representation offers a wide dynamic range and enables computations on pixel values, such as rescaling by applying a log function. It is the natural representation for working with color planes loaded from frames in a FITS file. The integer representation is relevant to standard image processing, for example to load or store a color image as a PNG file.
RGBImage properties include the shape of the image (number of horizontal pixels, number of vertical pixels), the range of the pixel values (minimum value, maximum value), and some representation of the pixel data itself. To avoid unnecessary conversions, and to keep the image representation as general as possible, an RGBImage maintains several variants of the pixel data. Conversions between these data types happen only when needed and are transparent to the user.
The implementation maintains the following variants of the pixel data:
An RGBImage can be created from the following sources:
An RGBImage can be repurposed as follows:
Other functions include:
There are several private properties:
A data property either holds a relevant value or it set to None. At all times, at least one data property holds a relevant value; if multiple data properties hold a relevant value, they represent the exact same image.
The allowed range for pixel values in the dpil and dbuf representations is fixed to 0..255 and thus does not need to be explicitly stored. For pixel data in the form of a numpy array however, the allowed range is flexible, and may be larger than the range actually used by pixel values. Thus the allowed range cannot be derived from darr.min()/darr.max() and must be explicitly stored. In other words, if darr is not None, then rangearr specifies the minimum and maximum allowed pixel values, and if darr is None, rangearr is also None.
| def pts.visual.rgbimage.RGBImage.__init__ | ( | self, | |
| source, | |||
frameIndices = None |
|||
| ) |
The constructor creates a new RGBImage from the source specified by the sole argument, as follows:
frameIndices=(34,12,0).
|
private |
This private function ensures that there is a valid numpy array representation, converting from one of the other representations if necessary, and invalidating the other representations if requested.
|
private |
This private function ensures that there is a valid buffer representation, converting from one of the other representations if necessary, and invalidating the other representations if requested.
|
private |
This private function ensures that there is a valid PIL image representation, converting from one of the other representations if necessary, and invalidating the other representations if requested.
|
private |
This private function sets the specified numpy array as internal representation, invalidating the other representations.
The array values are converted to 8-byte floating point if needed.
|
private |
This private function sets the specified RGBA buffer or string as internal representation, invalidating the other representations.
|
private |
This private function sets the specified PIL image as internal representation, invalidating the other representations.
The image is converted to RGB mode if needed.
| def pts.visual.rgbimage.RGBImage.addBelow | ( | self, | |
| image | |||
| ) |
This function places the specified RGBImage below the receiving image.
It is the caller's responsibility to ensure that both images have the same width (in pixels).
| def pts.visual.rgbimage.RGBImage.addRight | ( | self, | |
| image | |||
| ) |
This function places the specified RGBImage to the right of the receiving image.
It is the caller's responsibility to ensure that both images have the same height (in pixels).
| def pts.visual.rgbimage.RGBImage.applyColorMap | ( | self, | |
| cmap | |||
| ) |
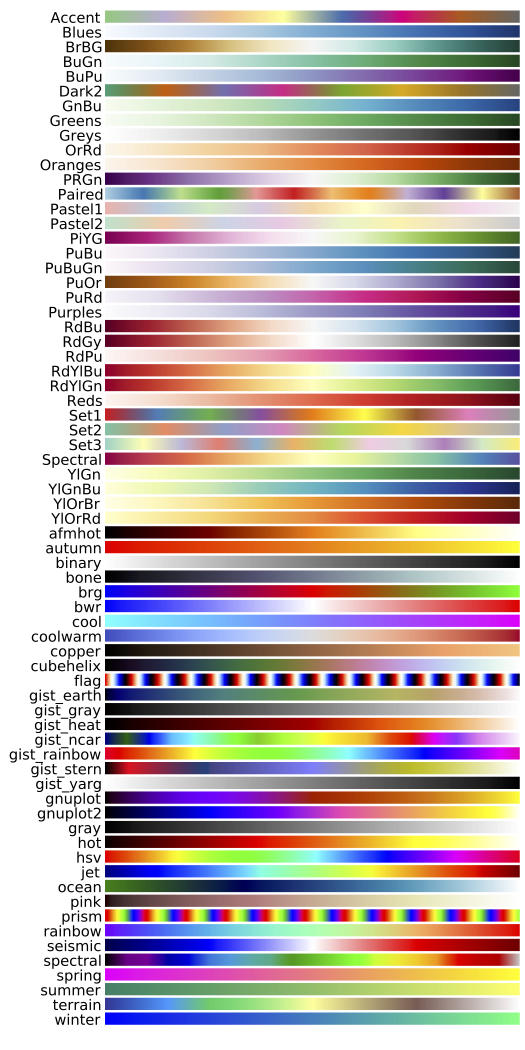
This function applies the specified color map to the (scaled) pixel values of the red channel, and replaces the image data with the result.
The cmap argument can be one of the following:
| def pts.visual.rgbimage.RGBImage.applyCurve | ( | self, | |
point1 = (0.25,0.16), |
|||
point2 = (0.80,0.86) |
|||
| ) |
This function applies a transformation defined by a cubic spline curve to the (scaled) pixel values, and replaces the image data with the result.
The pixel values are scaled to the interval [0,1]. The curve is composed of three cubic spline segments connecting the four points \((0,0),\,(x_1,y_1),\,(x_2,y_2),\,(1,1)\) with \(0<x_1<x_2<1\), where the outer points are fixed and the inner points are provided as arguments to this function.
| def pts.visual.rgbimage.RGBImage.applyLog | ( | self | ) |
This function applies the natural logarithm function to the pixel values of the image, and adjusts the pixel range accordingly.
This function raises an error if the pixel range includes zero or negative values when this function is called. This can be avoided, for example, by calling the setrange() function with a nonzero minimum value before calling the applylog() function.
| def pts.visual.rgbimage.RGBImage.applySqrt | ( | self | ) |
This function applies the square root function to the pixel values of the image, and adjusts the pixel range accordingly.
This function raises an error if the pixel range includes zero or negative values when this function is called. This can be avoided, for example, by calling the setrange() function with a nonzero minimum value before calling the applylog() function.
| def pts.visual.rgbimage.RGBImage.bytesArray | ( | self | ) |
This function returns the image's pixel data as a bytes object in the rgba format that can also be obtained from mtplotlib (3 RGB channels plus a dummy alpha channel, 8 bits each).
| def pts.visual.rgbimage.RGBImage.enlargeCanvas | ( | self, | |
| shape | |||
| ) |
This function adds pixel rows and/or columns to the receiving image if needed to match a given shape.
Each direction (horizontal and vertical) is handled separately. Extra pixels are added equally on both sides of the image (left/right or top/bottom), and are given a value of zero. Pixels are never removed. The target shape can be specified as a 2-tuple (nx,ny), or by providing another RGBImage object.
| def pts.visual.rgbimage.RGBImage.percentilePixelRange | ( | self, | |
from_percentile = 0, |
|||
to_percentile = 100 |
|||
| ) |
This function determines the range of the image's pixel values, ignoring zero and negative values, and omitting outliers on both sides of the scale as specified by the from and to percentiles.
The resulting range is returned as a tuple (min, max).
| def pts.visual.rgbimage.RGBImage.pixelArray | ( | self | ) |
This function returns the image's pixeldata as a 3D numpy array with shape (nx, ny, 3).
| def pts.visual.rgbimage.RGBImage.pixelRange | ( | self | ) |
This function returns the range of the image's pixel values as a tuple (min, max).
| def pts.visual.rgbimage.RGBImage.plot | ( | self, | |
fill = False |
|||
| ) |
This function plots the image to the current axes in the current matplotlib figure.
The image is rescaled to fit the axes. If fill is True, the image is stretched to fit the axes in both directions changing the image aspect ratio if needed. If fill is False (the default), the axes aspect ratio is adjusted so that the image aspect ratio is preserved.
| def pts.visual.rgbimage.RGBImage.saveTo | ( | self, | |
| outFilePath, | |||
tiff16bit = False |
|||
| ) |
This function saves the image to a file with the specified /em outFilePath in one of the supported formats.
The file format is chosen based on the filename extension in the /em outFilePath, which /em must be one of .jpg, .jpeg, .png, .tif, .tiff, .pdf or .fits (case insensitive). The image is saved in RGB mode. If the tiff16bit argument is True and the filename extension is .tif or .tiff, the image is saved with 16 bits per sample rather than the standard 8 bits per sample; however in this case the image data is not compressed. JPEGs are compressed with quality 80 on a scale of 1 to 100. FITS files contain a data cube with three data frames in the order BGR, matching the SKIRT convention of storing data cube frames in order of increasing wavelength.
| def pts.visual.rgbimage.RGBImage.scaledPixelArray | ( | self, | |
| newmin, | |||
| newmax | |||
| ) |
This function returns the image's pixel data as a 3D numpy array with shape (nx, ny, 3), after scaling the data to the specified range, but without affecting the data in the image itself.
| def pts.visual.rgbimage.RGBImage.scaleValues | ( | self, | |
| newmin, | |||
| newmax | |||
| ) |
This function applies a linear transformation to the pixel values and to the pixel value range, such that the previous range is exactly mapped onto the new specified range.
| def pts.visual.rgbimage.RGBImage.setRange | ( | self, | |
newmin = None, |
|||
newmax = None |
|||
| ) |
This function changes the pixel value range without affecting the actual pixel values except that, if the new range is smaller than the previous range, the pixel values are clipped to the new range.
One can specify a new minimum, a new maximum, or both.
| def pts.visual.rgbimage.RGBImage.shape | ( | self | ) |
This function returns the image's shape as a tuple (nx, ny).